Title:
RC Circuits and Oscilliscopes
Objectives:
- Gain experience using the oscilloscope to analyze time varying circuits
- Design and test an RC circuit
Background:
A squarewave is a signal that is on for a short time then off for a short time. By
using a squarewave voltage source, when the squarewave is on the source is exciting
the circuit. Then when the squarewave is off the source is effectively removed from
the circuit and the capacitor can discharge.
Preparation:
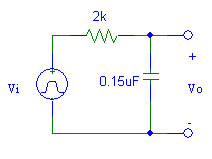
- Calculate the time constant for the RC circuit below.
- Use PSpice to perform a transient analysis of the circuit. A transient analysis can
be found under the setup option in the analysis menu. Use a step time of 0 ns and
a final time of 10 ms. Use Probe to plot Vo when Vi is:
- a 0 V to 10 V squarewave with a frequency of 100 Hz. (A squarewave is modeled in PSpice
using a VPulse source setup with V1=0, V2=10, TD=0, TR=1u, TF=1u, PW=5m, PER=10m.)
- a 0 V to 10 V squarewave with a frequency of 1 kHz. (Setup VPulse with V1=0, V2=10, TD=0, TR=1u, TF=1u, PW=500u, PER=1m.)
- Swap the positions of the capacitor and resistor and repeat the transient analysis.
- Watch an Oscilliscope Tutorial online such as this one: click here
Equipment and Parts:
- Prototyping board
- Signal Generator
- Oscilloscope
- Resistor: 2 kΩ
- Capacitor: 0.15 μF
Procedure:
- Create the RC circuit from the preparation on a protoboard. Record measured element values.
- Observe Vo on the oscilloscope with a 0 V to 10 V squarewave input signal of 100 Hz. Draw Vo versus Vi in your lab book.
- Measure the time constant on the oscilliscope by noting the time it takes Vo to lose 63.2% of its value.
- Calculate the capacitance of the capacitor from the time constant and resistance measurement.
- Change the input signal frequency to 1 kHz. Observe and record Vo.
- Swap the positions of the capacitor and resistor.
- Observe Vo on the oscilloscope with a 0 V to 10 V squarewave input signal of 100 Hz. Draw Vo versus Vi in your lab book.
Conclusions:
- Compare the observed/measured waveforms and time constants with the PSpice simulations.
Suggest possible reasons for any discrepancies.
- Discuss how well the objectives were met.
